The numbers you need, already written up.
A library of ready-made reports, scheduled delivery and dashboards you build yourself — across fleet, assets, people and jobs, not one product at a time.
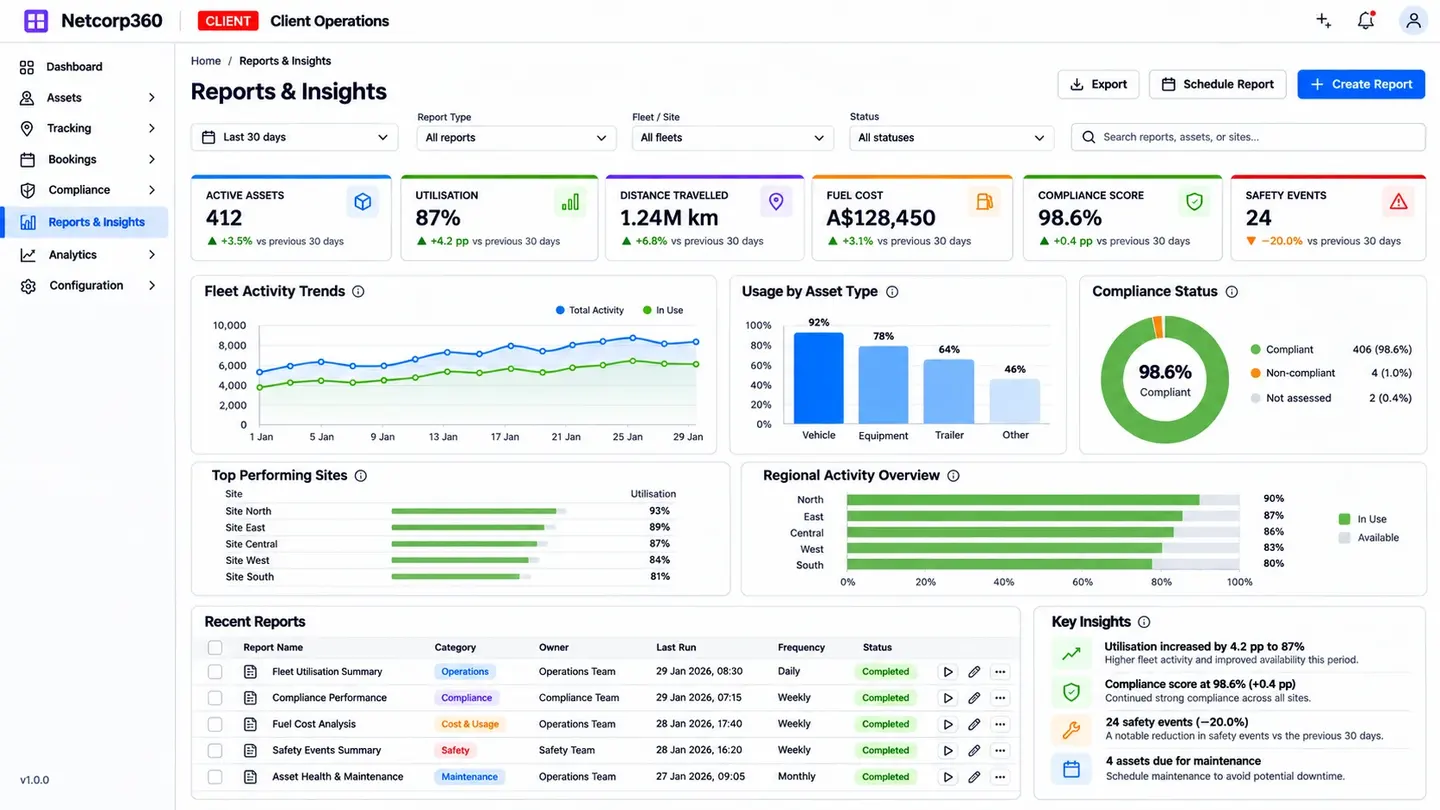
Start from a report that already exists.
Utilisation, driver behaviour, fuel, servicing, compliance and cost reports are ready on day one. Filter by site, business unit or asset type.
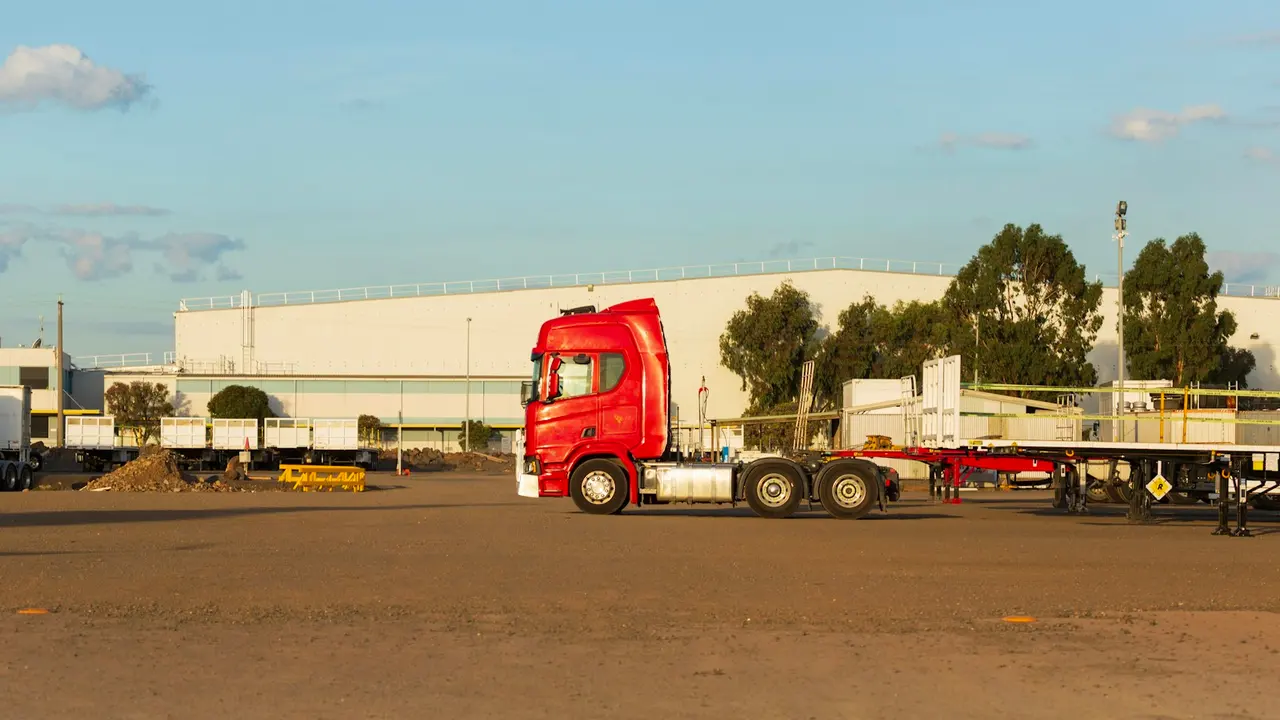

The right report, in the right inbox, on time.
Schedule any report daily, weekly or monthly and send it to the people who need it, as a PDF or a spreadsheet.
One screen for each person's job.
Build a dashboard from the measures that matter to you and share it by role, so a site supervisor and a finance manager each see their own picture.
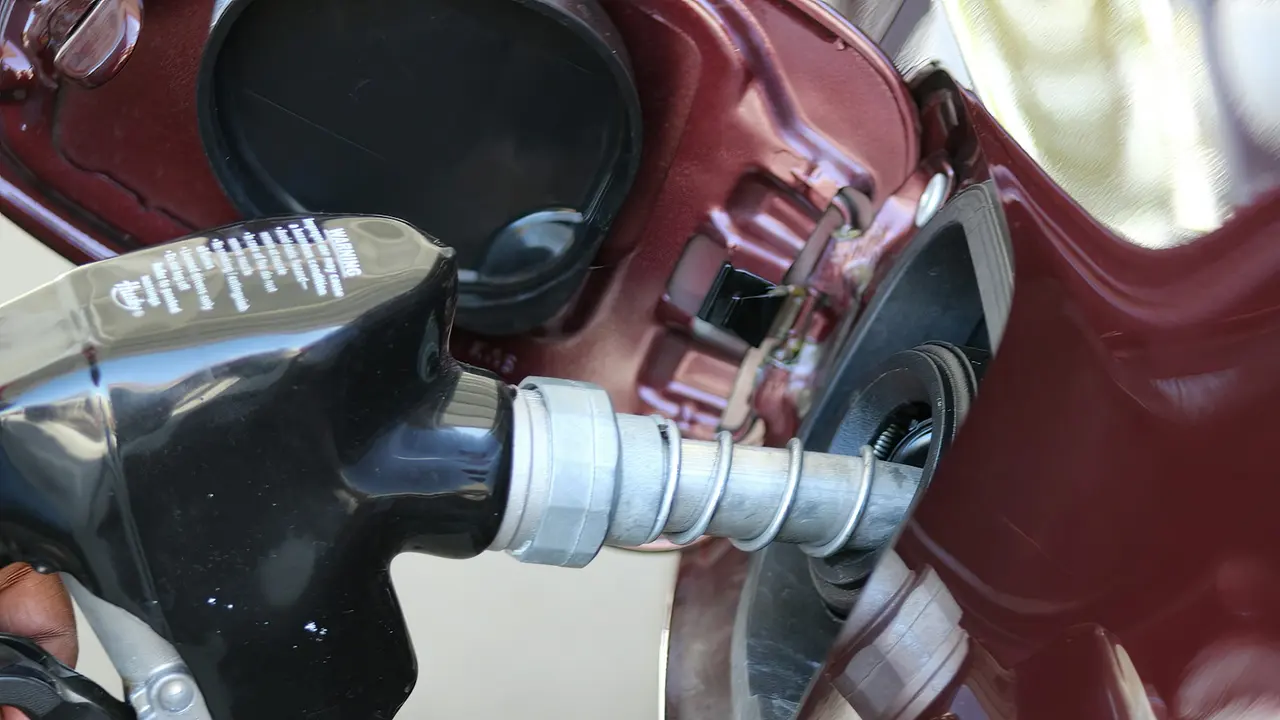
Emissions figures that stand up to an audit.
Emissions are calculated from fuel type and the fuel each engine actually burned, so the figure is measured and traceable rather than estimated from distance.
Know what the equipment did, not just the truck.
Drums, power take-offs, pumps and other auxiliary equipment are reported separately from the vehicle, so you can see what is working and what is sitting idle.