Launching January 2027Finally a complete business and vehicle monitoring eco-system in one AI Powered SolutionRegister for early access
Building Solutions for Business Since 1999
Netcorp360 Reports & Insights

The numbers you need, already written up.

A library of ready-made reports, scheduled delivery and dashboards you build yourself — across fleet, assets, people and jobs, not one product at a time.
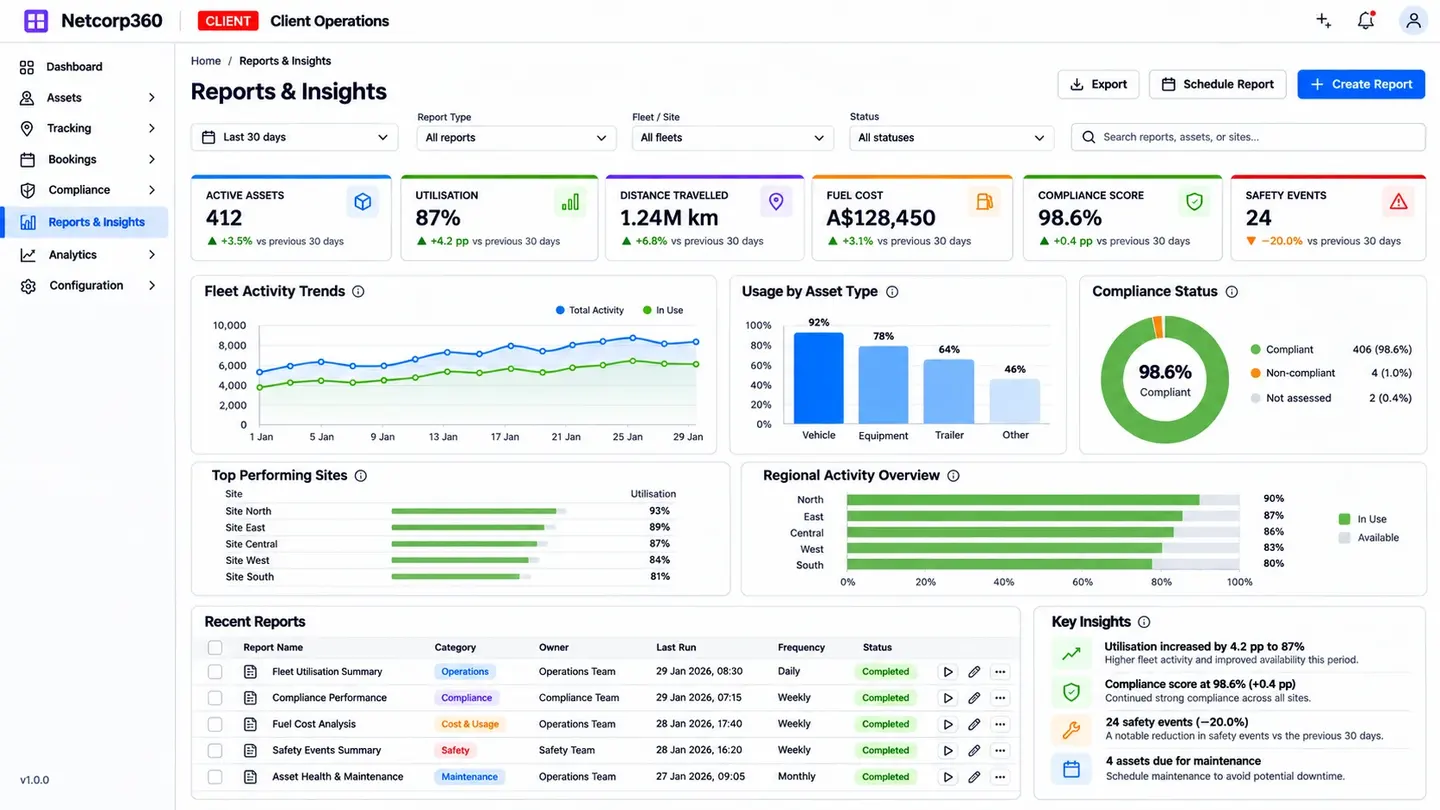
Reports dashboard with utilisation, distance, fuel cost, compliance score and recent reports
Ready-madereport library covering fleet, assets, people and jobs
Scheduleddelivery by email, as PDF or spreadsheet
Measuredemissions from fuel actually burned, not distance
By roledashboards that show each person only what's theirs
01 · Report library

Start from a report that already exists.

Utilisation, driver behaviour, fuel, servicing, compliance and cost reports are ready on day one. Filter by site, business unit or asset type.
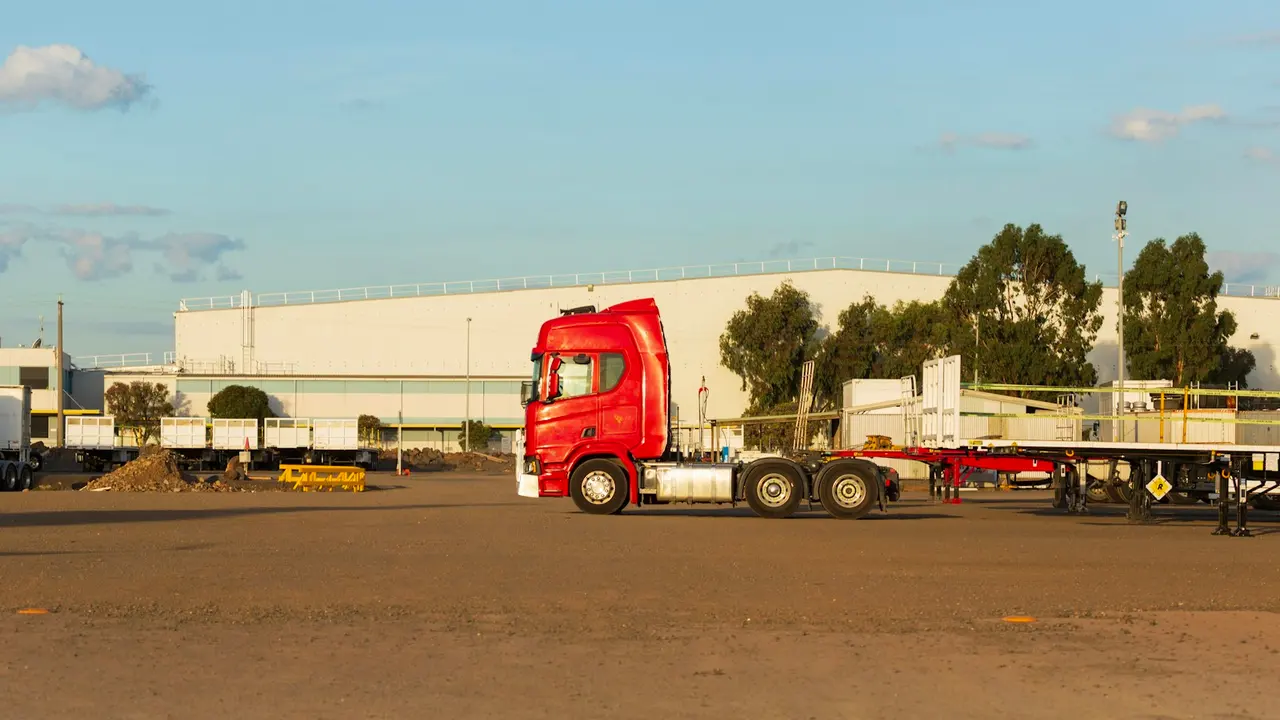

A prime mover and trailer in a depot yard
A man reading a laptop at a workshop parts counter
02 · Scheduled reports

The right report, in the right inbox, on time.

Schedule any report daily, weekly or monthly and send it to the people who need it, as a PDF or a spreadsheet.

03 · Dashboards

One screen for each person's job.

Build a dashboard from the measures that matter to you and share it by role, so a site supervisor and a finance manager each see their own picture.
Reports dashboard with utilisation, distance, fuel cost, compliance score and recent reports
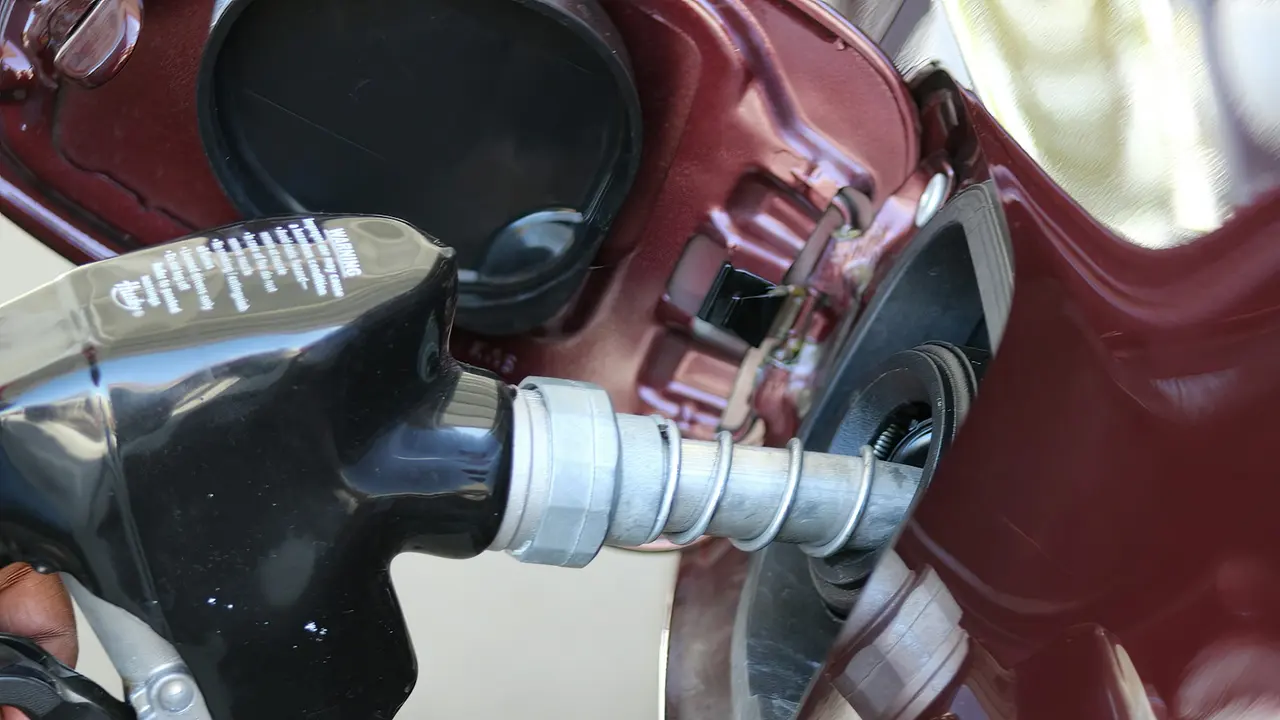
A fuel nozzle filling a vehicle’s tank
04 · Emissions & fuel

Emissions figures that stand up to an audit.

Emissions are calculated from fuel type and the fuel each engine actually burned, so the figure is measured and traceable rather than estimated from distance.

05 · Equipment utilisation

Know what the equipment did, not just the truck.

Drums, power take-offs, pumps and other auxiliary equipment are reported separately from the vehicle, so you can see what is working and what is sitting idle.

A concrete agitator truck on a building site, seen from above
NAIVA · AI for Reports & Insights

“Summarise last month for the operations meeting: utilisation, fuel and anything unusual.”

Utilisation rose to 71%. Fuel per engine hour was steady. Three things stand out: two loaders idled more than half their running time, one van moved after hours twice, and four services are overdue.

Illustrative example
Can we build our own reports?

Yes. Start from a library report and change the filters and columns, or build a dashboard from scratch.

Can we send data to our own reporting tools?

Yes. Use scheduled exports or the API to send data to the reporting tools you already use.

How are emissions calculated?

From the fuel type and the fuel each engine actually used, read from the engine. Where an asset has no engine data connection, we'll tell you how it is estimated.

See your own numbers, already written up.

Register for early access